What is Stress?
- Stress is an essential part of Cargill's Risk Metric System.
- It provides a forward looking and subjective estimation of market loss potential.
This module is audio supported.
Please select the audio button to listen to the corresponding audio.
A transcript is also available on every audio screen.
We recommend you plug in your headphones for a better audio experience.
This module enables you to answer key questions about Stress:
Watch this video to learn about Cargill's Market Risk Framework and the importance of Stress.
Hover over each tile to view the examples.
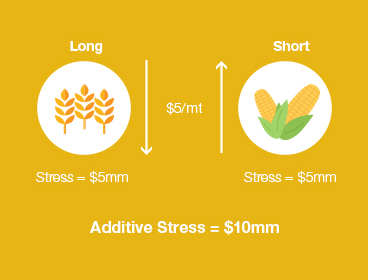
With additive stress, we stress WHEAT down $5/mt, generating a stress of $5mm, and we stress CORN up $5/mt, generating a stress of $5mm. We sum both, giving an additive stress for this book of $10mm.
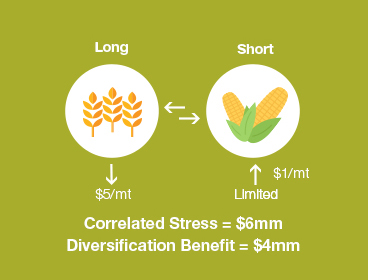
For correlated stress, we will assume that even in severe cases WHEAT and CORN remain linked to each other, and a strong down move on WHEAT will limit the upside on CORN. As a result, we may stress $5/mt down on WHEAT but only $1/mt up on CORN, resulting in a Correlated Stress of $6mm.
The diversification benefit here is $4mm, which is the difference between Additive and Correlated Stress.
Hover over each icon to learn the strengths and weaknesses of Stress.


How do we know it’s working?
Unlike statistical metrics, Stress is a discretionary and forward-looking measure that is more severe and not reached frequently.
As a result, most businesses compare stress levels to extreme P/L days or when they reach P/L Flags to evaluate their calibration.
Select the Example button to learn more.
Hover over the characters to learn more.
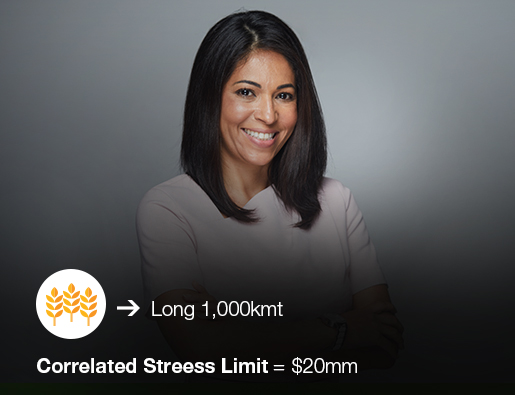
Andrea is grain trader. She currently holds a long wheat position of 1,000kmt, and has a Correlated Stress limit of $20mm.
Andrea sees a great trading opportunity in the coming days and wants to understand the risk she currently holds and evaluate if she has room to trade a bigger position.
Andrea knows that she needs to manage her position sizing to be within limits, at all times, or request a limit extension in advance to ensure she doesn’t breach her limit.
She decides to talk to her risk manager about the current stress assessment.
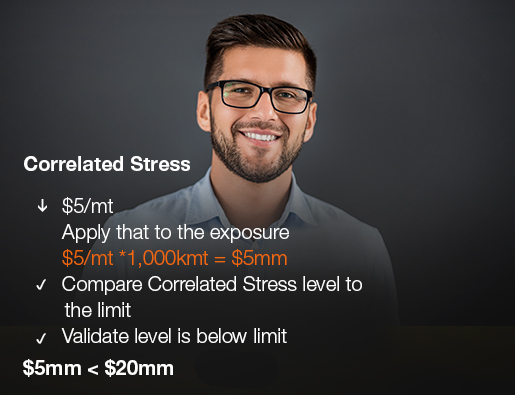
The risk manager explains that stress has been calibrated down $5/mt.
When we apply that unit move to the exposure the business' correlated stress then becomes: $5mm.
We compare that Correlated Stress level to the Stress limit, to validate that we are within the Stress limits.
In this case, $5mm is less than $20mm. So the risk manager confirms to Andrea that she is within limits, and still has room to deploy more risk against the foreseen trading opportunity.
If the Correlated Stress level is very close to limits and the business wants to exceed it, they can request a limit extension to the CRC.
Now that you have completed this module, you should be able to answer the following questions about Stress:
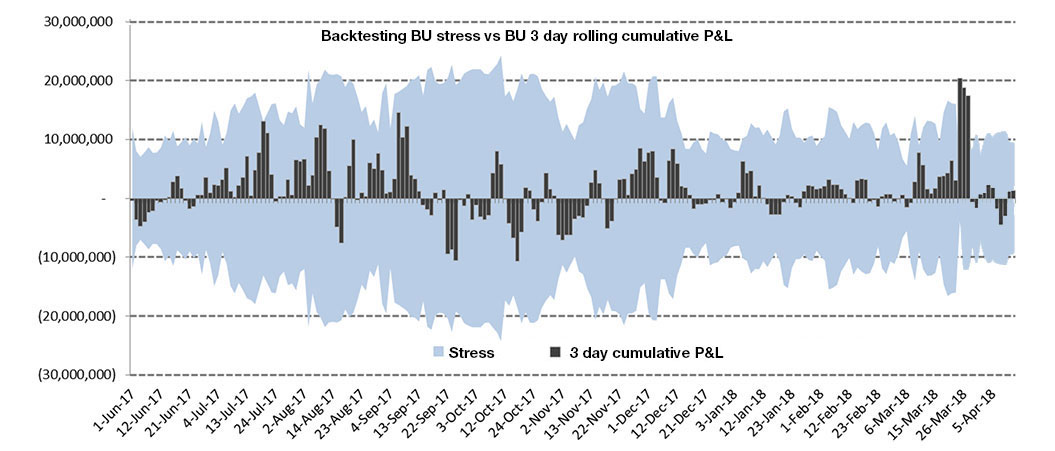
This is an example from the Metals business. Black bars are 3-day P/L and the blue-shaded area represents Stress. When Stress is properly calibrated, big P/L events come close, but we don't breach it often.