Trading Performance Metrics
Scroll down to continue learning.

What are Trading Performance Metrics?

Trading Performance Metrics are a set of statistics that provide insights into trading, and how a trader generates his/her P/L.

They are objective data points that bring meaningful insights to stakeholders.
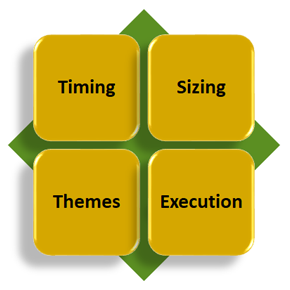
Relevance of Trading Performance Metrics at Cargill

Performance Metrics foster a culture of learning with emphasis on continuous improvement.

Select each image to learn more.

Select each image to learn more.

Scroll ahead for a more detailed look at the value of performance metrics and why they matter at Cargill.

Why do Trading Performance Metrics Matter?

Performance Metrics are objective data points that bring meaningful insights to stakeholders.

Performance Metrics:

Highlight how profits and losses were generated versus focusing only on the end of year value
Allow the objective study of trading in Cargill, identifying where we have the highest success returning on, and protecting, Cargill's capital
Assist in determining budget expectations, risk appetite, and risk tolerance discussions around the risk required to realistically meet targets
Provide comparable data points for coaching and understanding what we do and don't do well as a trading organization
Are used for trend analysis for assessment on a year-to-year basis to help determine the best risk allocation for Cargill

Marcel Smits’s view on performance

Now let’s hear Marcel Smits’s thoughts about performance metrics.

Play this audio to hear Marcel Smits.

Baseline Performance Metrics

This set of metrics at right was chosen as the baseline for all groups to provide transparency ensuring that Cargill is getting the best return for the risk deployed by groups and traders.

Metrics normalize the results of traders across Cargill regardless of their experience, position, or commodity traded.

This approach considers stakeholder feedback and external benchmarking and incorporates existing practices.

Select each button to read a brief summary of each metric.

Gains/Losses being generated over a period of time. Commonly shared as a before tax number.
Compares P/L generated to the risk used. The most basic metric regarding return on risk.
Reflects positive P/L days against total trading days in period observed. When the ratio is above 50% positive days exceed negative days.
Highlights the magnitude of the up days relative to the down days. When the ratio is above 100% then the average positive day is greater than negative.
Calculates where the current P/L is relative to the high-water mark. Never positive and always want the Draw-Down to be close to zero.
Calculates number of days under the high-water mark.
Calculates where the current P/L is relative to the low water mark. Opposite of Drawdown.

Additional Metrics

For enhanced trading insights, businesses may choose additional metrics that are relevant for their specific needs and reflect industry benchmarking. Some of these metrics are listed below, and they use the same inputs and information that baseline metrics require.

  • VaR Usage
  • Ratio of P/L to Target
  • Sortino Ratio
  • Calmar Ratio
  • Return on Maximum Draw-Down
  • Sterling Ratio
  • Opportunity/Expectancy Capture
  • Industry Specific Metrics

Now let’s explore key strengths and weaknesses associated with these baseline metrics.

Select each metric to view the strengths and weaknesses.

Strengths

The easiest metric to interpret.

Trading targets are expected to always be based around the P/L generated from a trader or trading group.

Weaknesses

Doesn’t give any color as to risk that was taken to achieve the results.

Potential lack of contribution from strategies (spreads, options, relative value, etc.)

Strengths

Highlights the amount of risk utilized for the returns (absolute P/L) generated.

Should be used in budgeting discussions correlating risk limits/deployed with absolute P/L expected in return.

Weaknesses

Needs to be further testing if this metric works equally well for physical and financial trading (physical could lead to a higher multiple over time), as well as, options books (theoretically options trading should lead to a higher multiple).

Strengths

Shows how many days that positions were directionally correct with market moves.

Works equally well for all types of trading.

Weaknesses

Must be paired with a P/L ratio to ensure that the whole picture makes sense.

>50% does not mean success if magnitude of P/L moves is skewed to the downside.

Doesn’t give color to the market environments that we trade best/worst in.

Strengths

Shows how well we were positioned with market moves, whether the “bigger” moves were captured or not.

Works equally well for all types of trading.

Weaknesses

Must be paired with a Hit ratio to ensure that the whole picture makes sense.

>100% does not mean success if loss days significantly outnumber gainers.

See Hit Ratio notes.

Strengths

Depending on the time of year and risk usage the metric can be used to help determine if it is possible to meet targets.

Works equally well for physical and financial trading.Can be used as a position management tool to ensure that losses don’t run beyond downside expectations for the strategy/trader/trading team.

Weaknesses

Little use in trend analysis, unless trader has a history of large draw-downs which would indicate poor performance.

Best used when comparing with other traders with like-strategies or commodities.

Strengths

A historical trend of low numbers to recovery show that the trader rebounds quickly to make new highs.

Long periods of draw-downs can highlight a trader in a slump or is missing something in the market.

Works equally well for physical and financial trading.

Weaknesses

Best used when comparing with other traders with like-strategies or commodities.

Looking at the metric exclusively without the context of drawdown or P/L will not be useful.

How do Performance Metrics support trading and risk performance?

Select Play to watch the video.

Summary

This completes the introductory module on Performance Metrics.

In this module, you learned:

  • Definition of Performance Metrics
  • How Performance Metrics are deployed in Cargill
  • Strengths and weaknesses of individual Performance Metrics

You are now ready to move to the module on the Application of Trading Performance Metrics.

Landscape Orientation is blocked. Switch to Portrait for better experience.